| Exercise 4 | The FME Data Inspector |
| Data | Zoning Data (GeoJSON) Neighborhoods (Google KML) |
| Overall Goal | Set up layer and dataset display |
| Demonstrates | Use of Display Control and Background Maps in the Data Inspector |
| Start Workspace | C:\FMEData2018\Workspaces\DesktopBasic\Basics-Ex4-Begin.fmw |
| End Workspace | C:\FMEData2018\Workspaces\DesktopBasic\Basics-Ex4-Complete.fmw |
In the previous exercise we inspected some data from a translation and added a second dataset. Now we can rearrange the data to make the display clearer.
1) Start FME Data Inspector
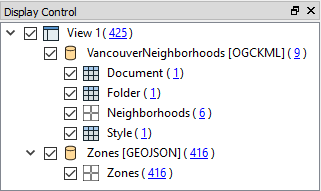
Continue in the FME Data Inspector from the previous exercise. You should have both the converted zones data (as GeoJSON) and a dataset of neighborhood boundaries in KML. The Display Control window looks like this:
2) Set Neighborhoods Symbology
The Display Control window shows a number of different layers in the VancouverNeighborhoods dataset. In reality most of these are tabular (non-spatial) items. The layer we are really interested in is called Neighborhoods.
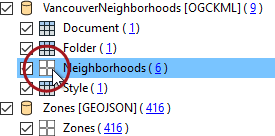
Click the symbology icon for the Neighborhoods data in the Display Control window:
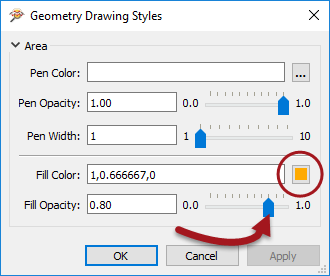
Set the color to be a neutral shade (like orange) and increase the opacity value to 0.8:
3) Set Draw Order
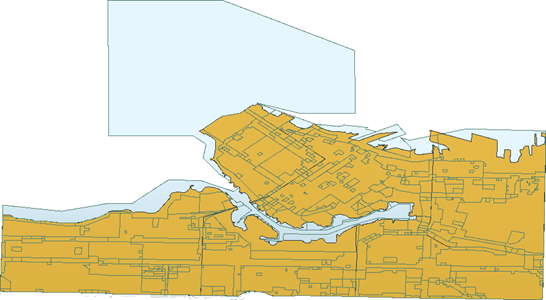
The previous change makes it clear that the zone features are below the neighborhoods in the drawing order. To solve this problem drag the Zones dataset above the VancouverNeighborhoods dataset in the Display Control Window.
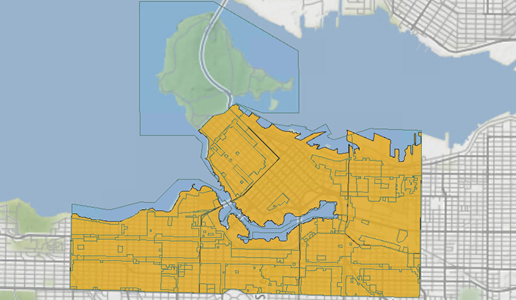
At the same time set a color for the zones data fill color and reduce the opacity value to 0.1. The main view will now look like this:
If you query a zone feature you'll see that it has both a ZoneCategory and ZoneName attribute. You might not realize, but there is a relationship between those attributes. Each ZoneName belongs to a specific ZoneCategory, where Category:Name is a 1:Many relationship.
Let's clarify the display by merging all the features into one feature per ZoneCategory. We can do that in FME Workbench.
4) Return to Workspace
Return to FME Workbench. Open the workspace saved in Exercise 2, or the workspace listed above.
What we'll do here is use what we call a transformer. This is something we'll cover in more detail in the chapter on Data Transformation. Basically it is an object to transform data in some way.
Click on the dark line connecting the Reader Feature Type and Writer Feature Type. Start typing the word "Dissolver":
![]()
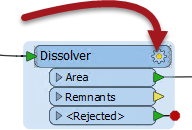
When you see the Dissolver transformer appear in the list, double-click on it to place it into the workspace. The result will look like this:
![]()
The Dissolver parameter will merge together all features with a common attribute value.
5) Set Dissolver Parameters
Click on the little cogwheel icon on the Dissolver transformer (it will probably be yellow in color):
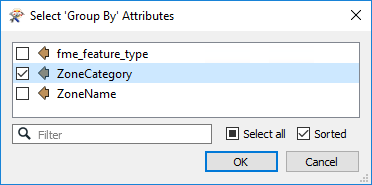
This will open a parameters dialog for the transformer. Click the elipsis (...) button next to the Group By parameter. In the dialog that opens select the ZoneCategory attribute and click OK.
Click OK again to close the parameters dialog.
Save the workspace and run it once more. The translation will run and the data be overwritten.
6) Refresh Data Inspector View
Back in the Data Inspector, rather than reopening the data, let's refresh the view of it. To do so click the Refresh button on the toolbar:
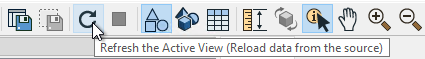
You'll now find there are fewer features, as many have been merged together.
7) Set Background
When inspecting data it will help to have a background map to provide a sense of location. The FME Data Inspector is capable of displaying a backdrop from several different mapping services.
Select Tools > FME Options from the menubar. In the Background Map section, select a background map format. If you have an account with a specific provider, please feel free to use that. Otherwise select Stamen Maps:
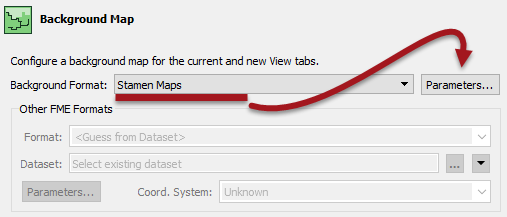
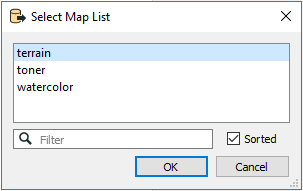
Click the Parameters button. A map constraint (type) dialog will open. Click the browse button and select "terrain":
Click OK and OK again to close these dialogs. A background map is added to the display. Notice that the data is reprojected to match the coordinate system of the chosen background. For example, the Stamen Maps background causes the data to reproject to Spherical Mercator, with a clear change of shape:
Map tiles by Stamen Design, under CC-BY-3.0. Data by OpenStreetMap, under CC-BY-SA.
8) Set Writer Parameters
One final task: the output GeoJSON file is intended for distribution via the internet, and you've been asked to make the file size as small as possible. Check the current file size. It will be approximately 362kb.
There are a couple of writer parameters that can be used to reduce GeoJSON file size.
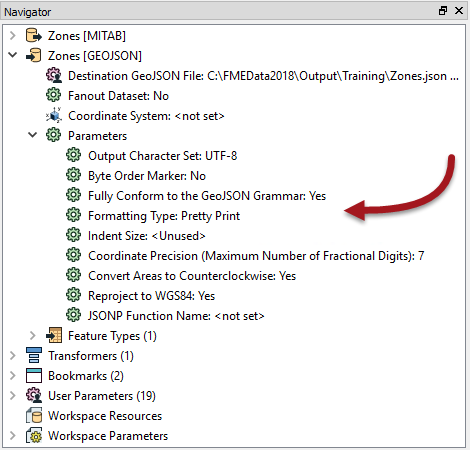
Explore the Navigator window in FME Workbench, and look for the GeoJSON writer parameters. Double-click on one of the parameters, such as Formatting Type:
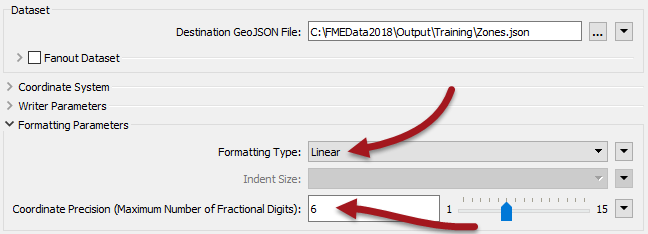
In the dialog that opens, set the Formatting Type to Linear and the Coordinate Precision to 6:
Re-run the workspace. You should find that the results are the same, but the file size is now closer to 232kb.
| CONGRATULATIONS |
By completing this exercise you have learned how to:
|